July 31, 2016 PTAB Trial Statistics
As of July 31, 2016, the Patent Trial and Appeal Board (“PTAB”) has updated the monthly statistics of the number of inter partes reviews (“IPR”), post-grant reviews of covered business method patents (“CBM”), regular post-grant reviews (“PGR”), and derivation proceedings (“DER”) that have been filed. These stats on progress are shown below, and can be found at:
https://www.uspto.gov/ip/boards/bpai/stats/aia_trial_statistics.jsp
The graph/chart form of these statistics with some explanations can be found here, which includes proceedings and progress statistics:
http://www.uspto.gov/sites/default/files/documents/2016-07-31%20PTAB.pdf
IPRs Are the Most Filed Petitions
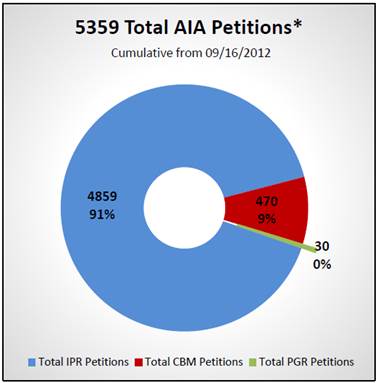
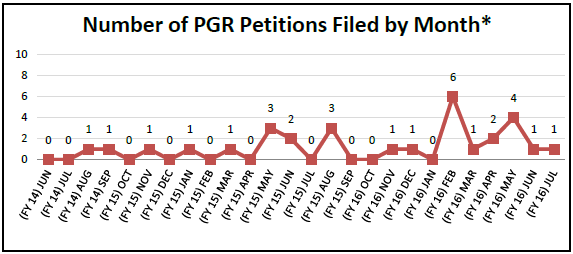
The first regular PGR (not for a CBM) was filed on August 5, 2014. As shown below, there are now 30 PGR petitions that have been filed. This should ramp up when more and more patents qualify (must be a first-inventor-to-file patent), and especially if Congress reduces the scope of estoppel (eliminating the “reasonably could have raised” language). Here’s the breakdown of the 5,359 AIA petitions (4,859 are IPR) filed as of July 31, 2016:
Here is a bar graph version (vast majority still being IPRs):
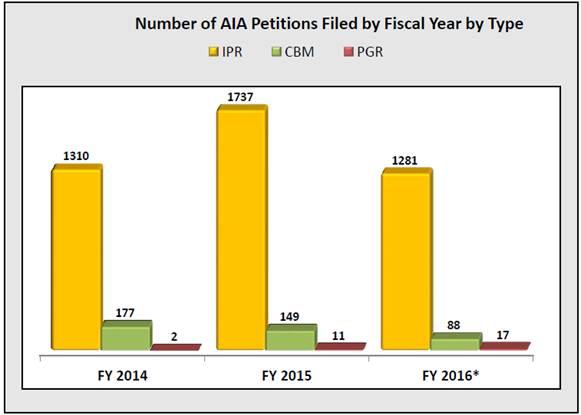
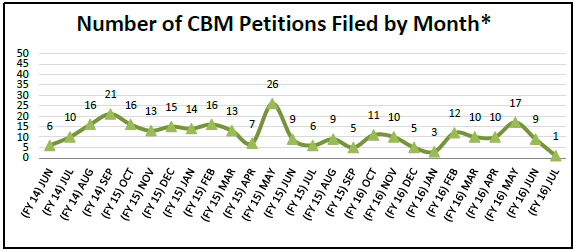
To break down the filing trends for IPR, CBM, and PGR separately on a monthly basis for the last two years, here are the graphs provided by the PTAB (note that the new fiscal year for the USPTO starts every October 1st). The IPR filings have been steady and relatively high in the past 2 years (possibly reaching a peak):
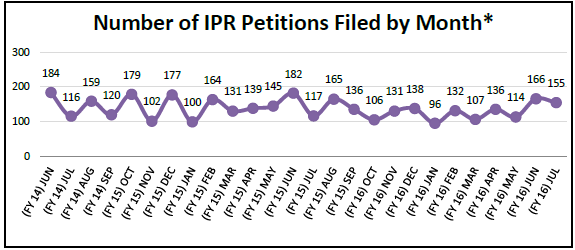
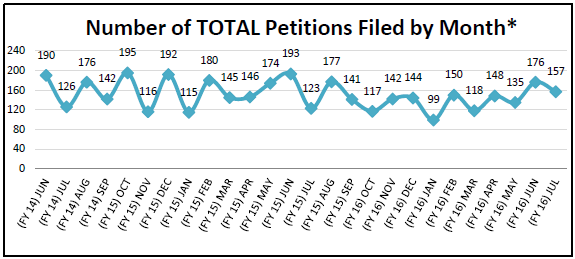
To break down the filing trends for a combined total of all IPR, CBM, and PGR petition filings on a monthly basis, here is the graph provided by the PTAB:
Institution, Disposal, Etc.
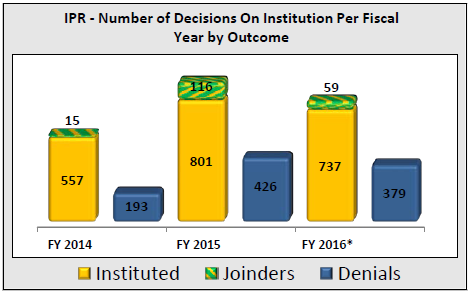
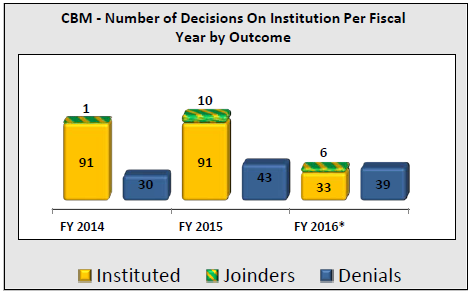
For the first phase of an AIA trial, the PTAB determines whether or not an IPR, PGR or CBM will be instituted. The PTAB may not authorize the IPR unless the petition and response shows there is a “reasonable likelihood” that the petitioner would prevail with at least one of the challenged claims.[1] The institution of a PGR/CBM trial requires an initial threshold requirement of “more likely than not,” which may be the same or slightly higher than the IPR threshold standard. However, the latest statistics clearly show that the initial threshold has been met the majority of the time. Below are charts depicting the filings for IPR, CBM and PGR, respectively, clearly indicating that the majority of filings lead to institution in IPR, but the trend seems to be reversing for CBM (again as of 07/31/2016):
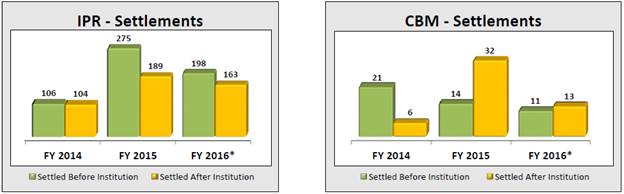
Regarding settlement, there are more settlements in IPR pre-institution, whereas in CBM there are more post-institution:
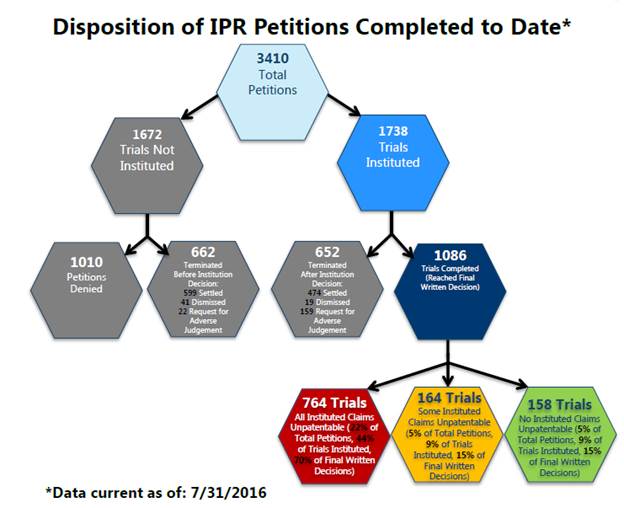
Below is another PTAB chart showing the break-down of outcomes for those IPRs that have been completed to date (again as of 07/31/2016). Out of the 3,410 total completed IPRs, 1,738 trials were instituted. Of the 1,672 that were not instituted, 1010 were denied, 559 settled, 41 dismissed, and 22 terminated with the request for adverse judgement.
The real question is what happens to those claims once there is institution. Of the 1,738 trials instituted, 1,086 proceeded to final written decisions, and 764 (70%) of them had all claims found unpatentable.
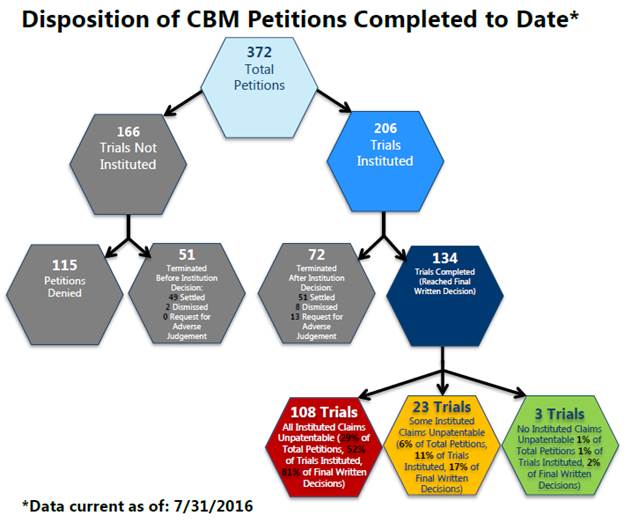
The chart below is for CBM filings (206 out of 372 instituted):
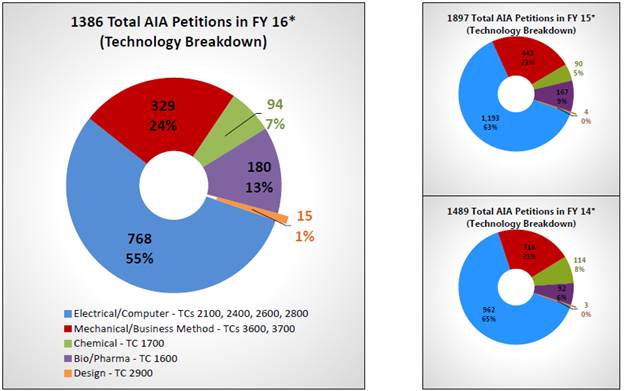
Filings by Technology
The petitions by technology breakdown are shown below. The majority is in the electrical/computer/software arts (but bio/pharma has increased, partially due to the hedge fund filings attacking pharmaceutical patents) (again as of 07/31/2016). Fiscal year filings for 2014 and 2015 are also shown below as well:
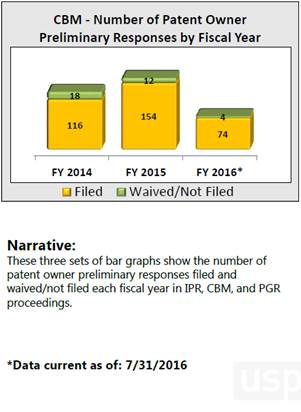
PO Preliminary Responses
During an IPR, PGR or PGR for CBM, the Patent Owner (“PO”) can optionally file a Preliminary Response.[2] Clearly, according to these statistics, the PO is choosing to file a Preliminary Response most of the time (overall 84% for IPRs in FY 2016). The number of filed PO Preliminary Responses is in the next chart (again as of 07/31/2016):

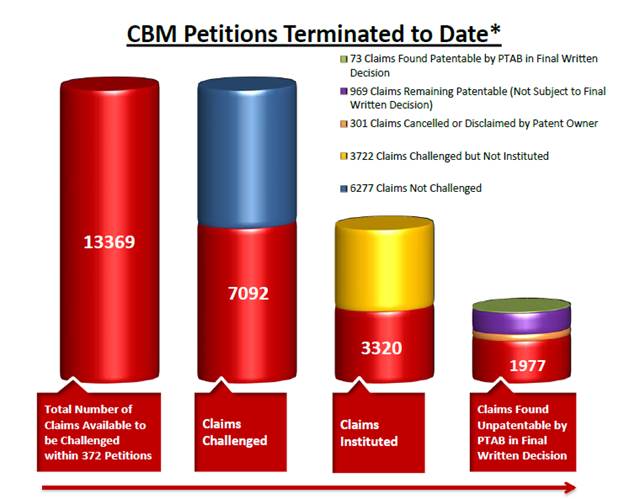
Termination
Below is a graph showing how these trials eventually end (again, as of 07/31/2016):
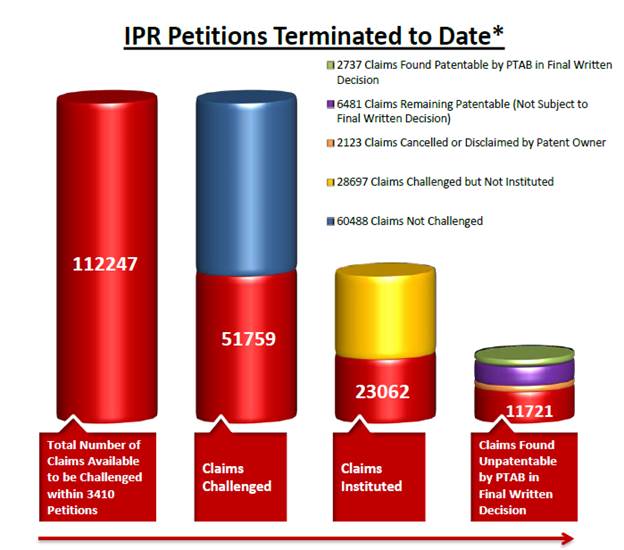
Left, red bar: total number of claims available that could be challenged in the IPR petitions filed.
Second most-left, blue and red bar: Blue indicates those claims not challenged; red are those claims challenged (51,759 claims).
Second most-right, yellow and red bar: Red indicates claims going to trial (23,062 claims); yellow are claims challenged but not instituted.
Right, multi-colored bar: See description above. Completed trials include a final written decision, denial of institution, settlement, request for adverse judgment or dismissal. Here, the purple likely indicates termination due to settlement, adverse judgment or dismissal, where there was no final written decision (FWD). Green are those claims found patentable in a FWD (2,737 claims out of 23,062 claims instituted or 12%). In total, 11,341 claims remained patentable after the completion of the proceedings out of 23,062 instituted (49%).
Here is the CBM version. Compared to IPRs, relatively fewer claims were found patentable in FWD (green portion of the rightmost bar) while relatively more claims that were not subject to FWD remained patentable (purple portion). Relatively more instituted claims (59%) were found unpatentable in FWDs (red portion):