
December 4, 2014 PTAB Trial Statistics
As of December 4, 2014, the Patent Trial and Appeal Board (“PTAB”) has updated the statistics of the number of inter partes reviews (“IPR”), post-grant reviews of covered business method patents (“CBM”), and derivation proceedings (“DER”) that have been filed. These stats are shown below, and can be found at:
http://www.uspto.gov/ip/boards/bpai/stats/aia_trial_statistics.jsp
Graph/chart form of these statistics are found here:
http://www.uspto.gov/ip/boards/bpai/stats/120414_aia_stat_graph.pdf
The proceeding statistics are found here:
http://www.uspto.gov/ip/boards/bpai/stats/aia_trial_proceedings.pdf
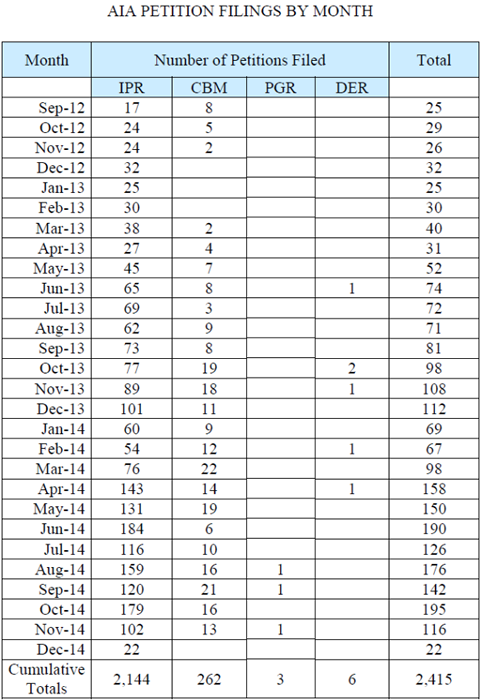
It is worth noting that the first regular PGR (not for CBM) was filed on August 5, 2014. As shown below, there are now 3 PGR petitions that have been filed.
The PTAB determines whether or not an IPR or PGR will be granted. The PTAB may not authorize the IPR unless the petition and response shows there is a “reasonable likelihood” that the petitioner would prevail with at least one of the challenged claimed.[1] The granting of a PGR trial requires an initial threshold requirement of “more likely than not”, and is slightly higher than the IPR threshold standard. However, the latest statistics clearly show that the initial threshold has been met the majority of the time (see the AIA Trials Instituted/Disposals chart below). Note that the new fiscal year (2015) for the USPTO has started. The number of AIA Petitions, where 2,144 IPR petitions have been filed, is as follows:
NUMBER OF AIA PETITIONS
| FY | Total | IPR | CBM |
PGR
|
DER |
| 2012 | 25 | 17 | 8 | ||
| 2013 | 563 | 514 | 48 | 1 | |
| 2014 | 1,494 | 1,310 |
177
|
2
|
5 |
|
2015
|
333
|
303
|
29
|
1
|
|
| Cumulative | 2,415 | 2,144 | 262 |
3
|
6 |
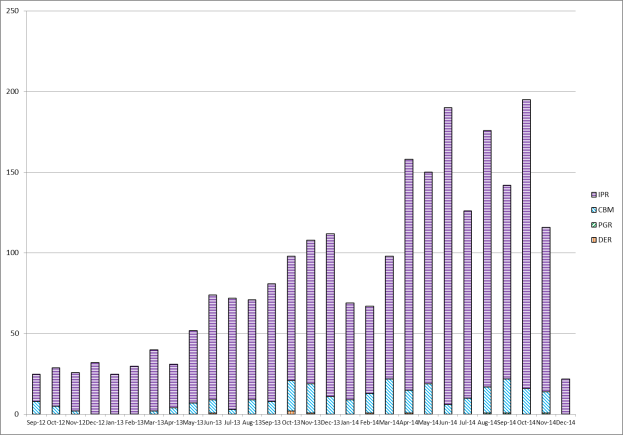
The graphic form of the AIA filings is shown below (note the decreased filing from Jan – March this year, but a surge since April 2014):
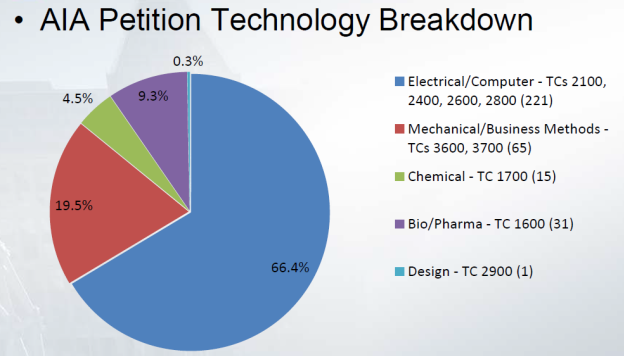
The petitions by technology breakdown are:
AIA PETITION TECHNOLOGY BREAKDOWN – FY 2015
|
Technology |
Number of Petitions | Percentage |
|
Electrical/Computer |
221 | 66.4% |
|
Mechanical |
65 | 19.5% |
|
Chemical |
15 | 4.5% |
|
Bio/Pharma |
31 | 9.3% |
|
Design |
1 | 0.3% |
The pie chart for these filings are as follows:
During an IPR, PGR or PGR for CBM, the Patent Owner (“PO”) can optionally file a Preliminary Response.[2] Clearly, according to these statistics, the PO is choosing to file a Preliminary Response most of the time (overall 81.4%). The number of filed PO Preliminary Responses is in the next chart:
NUMBER OF PATENT OWNER PRELIMINARY RESPONSES
| Filed | Waived | |||||
| FY2013 | FY2014 |
FY2015
|
FY2013 | FY2014 |
FY2015
|
|
|
IPR |
237 | 829 |
236
|
63 | 202 |
49
|
|
CBM |
33 | 116 |
23
|
2 | 18 |
3
|
| PGR |
1 |
|||||
The institution rate now includes fiscal year 2015 as shown below. Note that there are already several cases of joinder in 2015.
AIA TRIALS/INSTITUTED DISPOSALS
| Trials Instituted | Joinders | Denials | Total No. of Decisions on Institution | Disposals | ||||
| Settlements | Final Written Decisions* | Other** | ||||||
| IPR | FY13 | 167 | 10+ | 26 | 203 | 38 | 2 | 1 |
|
FY14 |
557 | 15+ | 193 | 765 | 210 | 169 | 1 | |
|
FY15
|
129
|
64+
|
46
|
239
|
57
|
52
|
||
|
CMB |
FY13 | 14 | 3 | 17 | 3 | 1 | ||
|
FY14 |
91 | 1+ | 30 | 122 | 27 | 16 | 2 | |
|
FY15
|
13
|
4
|
17
|
12
|
3
|
|||
| PGR |
FY15
|
1
|
||||||
|
DER
|
FY14
|
3
|
3
|
|||||
+90 cases joined to 56 base trials for a total of 146 cases involved in joinder.
*Includes judgment on request for adverse judgment.
**Includes terminations due to dismissals.
A month-to-month view of the filings:
More information on the USPTO PTAB can be found here.
- 77 Fed. Reg. 48764 (Aug. 14, 2012).
- Id. at 48756.